

Quarter closed 30 June 2026
REIC, in Thai
when REIC releases Q3
These are the most recent official figures available, but they describe a quarter that closed on 30 June 2026, not the market as it stands today. The lag is normal: the data comes from completed Land Department registrations, not from sales or reservations. Next update expected mid-December 2026, when REIC is due to release Q3.
Why This Page Exists
Thailand’s Real Estate Information Center (REIC), part of the Government Housing Bank, publishes the official count of condominium units transferred to foreign buyers every quarter. It is the only complete national figure, and it comes from Land Department records rather than from listings or estimates.
The report is published in Thai, as a PDF. English-language coverage appears three or four days later and carries the headline: the total unit count, the total value, and the list of top buyer nationalities in order. What it usually leaves out is the detailed table, which gives units, value, average price and year-on-year growth for each nationality.
That table is the part worth having. It is where you can see that Russian buying grew while Chinese buying shrank, and by how much. We translate it here in full, alongside the quarterly series going back to 2022, and we update the page each quarter. The original Thai documents are linked at the bottom so you can check anything yourself.
The Headline Figures
Up 1.4% year on year. Worth 14,803 million baht, up 20.2%, across 145,140 square metres, up 8.1%.
Down 8.8% year on year. Worth 28,267 million baht, down just 1.5%.
And 20.0% of transfer value. Both shares fell, and the reason is not the obvious one.
Note the gap between those two middle figures. Across the first half, volume fell 8.8% but value fell only 1.5%, so the average transfer was larger: 4.3 million baht for 43.9 square metres, against roughly 4.0 million for 41.7 square metres a year earlier. Most of that shift is size rather than price. The 2025 averages are our own calculation from REIC’s published half-year totals.
As for the falling share, the reason is not the obvious one, and we come back to it below.
The Full Table by Nationality, First Half 2026
This is the part of the report we have not found published in English anywhere else. Ranked by transfer value, first half of 2026, nationwide.
| # | Nationality | Units | Value (M฿) | Avg per unit (M฿) | Avg size (sqm) | Units YoY | Value YoY |
|---|---|---|---|---|---|---|---|
| 1 | China | 1,813 | 6,874 | 3.8 | 38.2 | -23.8% | -27.7% |
| 2 | Russia | 842 | 3,603 | 4.3 | 41.8 | +50.4% | +75.9% |
| 3 | Myanmar | 641 | 2,457 | 3.8 | 34.9 | -34.1% | -16.2% |
| 4 | United States | 254 | 1,668 | 6.6 | 57.9 | -6.3% | +22.2% |
| 5 | Taiwan | 334 | 1,465 | 4.4 | 33.9 | -11.6% | -10.1% |
| 6 | France | 291 | 1,211 | 4.2 | 49.4 | -11.3% | -5.0% |
| 7 | United Kingdom | 255 | 1,116 | 4.4 | 53.2 | +6.7% | -9.3% |
| 8 | Germany | 241 | 954 | 4.0 | 47.6 | +8.1% | +15.5% |
| 9 | Australia | 185 | 814 | 4.4 | 53.5 | +63.7% | +61.0% |
| 10 | India | 128 | 810 | 6.3 | 72.1 | +15.3% | +9.3% |
| — | All others | 1,549 | 7,295 | 4.7 | 48.7 | -2.7% | +9.7% |
| Total | 6,533 | 28,267 | 4.3 | 43.9 | -8.8% | -1.5% |
Source: Department of Lands, compiled by the Real Estate Information Center (ศูนย์ข้อมูลอสังหาริมทรัพย์ / REIC), Government Housing Bank. Every column above, including the averages and the year-on-year percentages, is published by REIC. Siam Glow translated the table and converted the calendar; we did not recalculate the figures. The table is ranked by transfer value rather than by units, which is why the United States sits fourth on 254 units while Taiwan sits fifth on 334.
Across all foreign buyers in the first half of 2026, the average transfer was 4.3 million baht for 43.9 square metres, which REIC puts at roughly 98,566 baht per square metre.
What the Growth Columns Show
Four things stand out once you have the growth columns.
842 units in the first half, with transfer value up 75.9%. In absolute terms the biggest gain in the table, and it moved Russia into second place by value. Their average purchase, at 4.3 million baht, is above the Chinese average.
Units up 63.7%, value up 61.0%. The base is small at 185 units, so a single active development can move that line, but the direction is clear and it has been building for more than a year.
Chinese buyers fell 23.8% in units and 27.7% in value. China remains the largest single group by a wide margin, but the national figure of -8.8% hides how much of the weakness sits with one nationality.
German transfers rose 8.1% in units and 15.5% in value. British transfers rose 6.7% in units but fell 9.3% in value, so more units at lower prices. French transfers fell 11.3%. Treating "European demand" as one trend gives an average that describes none of them.
Why the Foreign Share Fell to 10.2%
Foreign buyers took 10.2% of all condominium units transferred in the second quarter of 2026. That is the lowest quarterly share since the second quarter of 2022, and a long way below the 18.0% peak of the first quarter of 2025.
Read on its own, that looks like foreign demand collapsing. It is not what happened. Foreign transfers actually rose slightly in the quarter, from 3,248 units a year earlier to 3,292. What changed is the denominator. Total condominium transfers nationwide jumped from 23,361 units in Q2 2025 to 32,204 units in Q2 2026, a rise of close to 38%. Both totals are published by REIC in the same report.
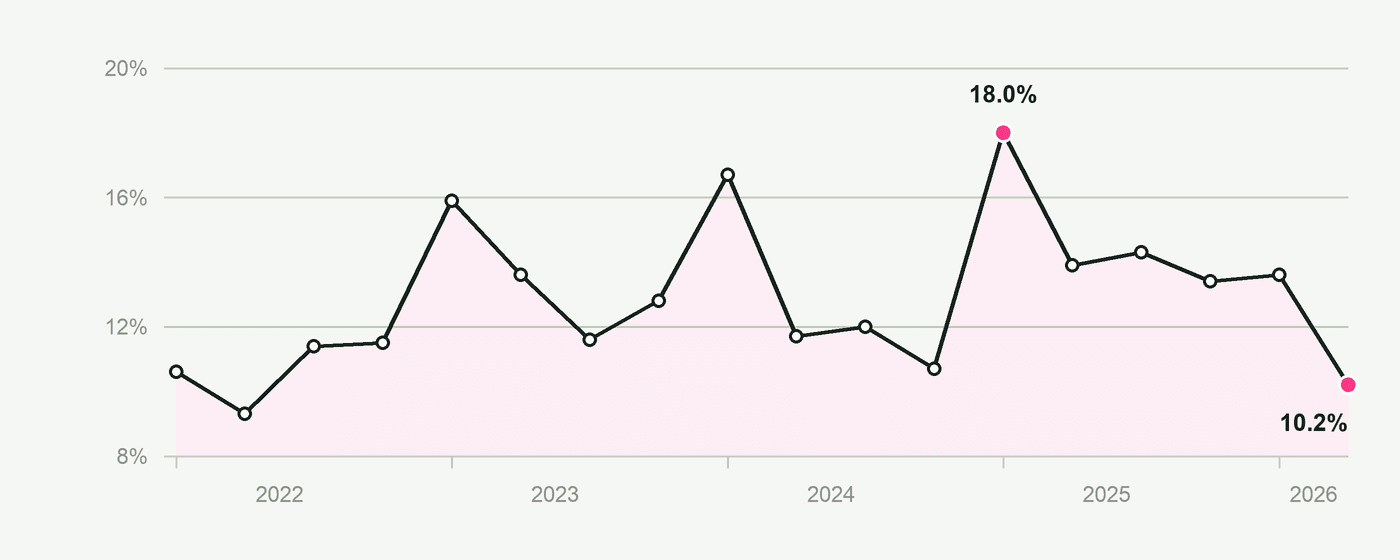
As for why domestic transfers surged, REIC points to state stimulus. In its Eastern Economic Corridor report published four days later, it names two measures supporting demand: the cut in transfer and mortgage registration fees to 0.01% each on homes priced up to 7 million baht, and the Bank of Thailand’s relaxed loan-to-value rules. REIC makes that link for the EEC specifically. Reading the national surge the same way is our inference, not REIC’s statement.
So the foreign share shrank because the Thai market grew, not because foreign buyers left. For anyone buying under a foreign freehold quota, that distinction matters. Under Section 19 bis of the Condominium Act B.E. 2522, foreign freehold is capped at 49% of the combined floor area of the units in a given registered condominium. It is a project-level limit, not a national one, so a busier domestic market does not reduce the quota available in the building you are looking at.
Eighteen Quarters of Data, 2022 to 2026
The full quarterly series. This is what lets you see whether a given quarter is a trend or noise.
| Quarter | Units | Value (M฿) | Area (sqm) | Share of units | Share of value |
|---|---|---|---|---|---|
| Q1 2022 | 2,107 | 10,217 | 97,031 | 10.6% | 19.5% |
| Q2 2022 | 2,323 | 12,101 | 109,396 | 9.3% | 18.7% |
| Q3 2022 | 3,351 | 17,398 | 153,061 | 11.4% | 22.0% |
| Q4 2022 | 3,780 | 19,544 | 170,942 | 11.5% | 21.1% |
| Q1 2023 | 3,775 | 17,128 | 168,664 | 15.9% | 24.3% |
| Q2 2023 | 3,563 | 18,083 | 166,303 | 13.6% | 24.6% |
| Q3 2023 | 3,365 | 17,048 | 152,526 | 11.6% | 21.1% |
| Q4 2023 | 3,746 | 20,901 | 171,722 | 12.8% | 26.1% |
| Q1 2024 | 3,938 | 18,013 | 173,007 | 16.7% | 28.6% |
| Q2 2024 | 3,322 | 14,821 | 151,560 | 11.7% | 21.1% |
| Q3 2024 | 3,756 | 18,571 | 165,367 | 12.0% | 23.4% |
| Q4 2024 | 3,557 | 16,778 | 152,730 | 10.7% | 19.9% |
| Q1 2025 | 3,919 | 16,392 | 164,376 | 18.0% | 29.3% |
| Q2 2025 | 3,248 | 12,318 | 134,270 | 13.9% | 23.1% |
| Q3 2025 | 3,844 | 15,376 | 153,635 | 14.3% | 24.8% |
| Q4 2025 | 3,888 | 16,834 | 162,817 | 13.4% | 23.2% |
| Q1 2026 | 3,241 | 13,464 | 141,644 | 13.6% | 23.9% |
| Q2 2026 | 3,292 | 14,803 | 145,140 | 10.2% | 20.0% |
Source: Department of Lands, compiled by the Real Estate Information Center (ศูนย์ข้อมูลอสังหาริมทรัพย์ / REIC). Years converted from the Thai Buddhist Era calendar used in the original, which runs B.E. 2565 to 2569. The period averages shown in REIC’s own charts are 3,445 units, 16,100 million baht and 151,899 square metres per quarter.
Chonburi and the Eastern Seaboard
REIC publishes a separate quarterly report on the Eastern Economic Corridor, which covers Chonburi, Rayong and Chachoengsao. The most recent edition came out on 15 September 2026.
In the first half of 2026, Chonburi recorded 15,928 residential transfers worth 39,249 million baht, up 15.1% in units and 8.8% in value. That is 65.9% of all EEC transfers by unit and 68.8% by value, so the province dominates its own region comfortably.
Broken down by property type, Chonburi’s half-year was 6,329 condominium units worth 14,269 million baht, and 9,599 low-rise homes worth 24,980 million baht. Within the low-rise total, townhouses led on volume at 4,271 units, while detached houses led on value at 12,105 million baht. On our own calculation from REIC’s provincial tables, Chonburi accounted for about 92% of all condominium transfers in the EEC over the half year, which is what you would expect given that most of the region’s condominium stock sits along the Pattaya coastline.
One caveat matters here, and English coverage of this report tends to skip it. These EEC figures cover all buyers, Thai and foreign together. REIC does not publish foreign transfers broken down by province in either of these two reports, so there is no official figure for how many of Chonburi’s 6,329 condominium transfers went to foreign buyers. Anyone who quotes a provincial foreign-buyer number is estimating, not citing.
One figure is worth adding, with the warning attached to it rather than to the paragraph. The average Chonburi condominium transfer in the first half came to about 2.25 million baht, counting Thai and foreign buyers together, against a national average of 4.3 million baht for foreign buyers alone. That 2.25 million is our own calculation, dividing Chonburi’s 14,269 million baht of condominium transfers by its 6,329 units. The two numbers describe different groups of buyers, so the gap is not a measurement of what foreigners paid in Chonburi and should not be quoted as one. Our impression from transactions is that foreign buyers tend to cluster in newer and better-located stock than the provincial average, which would explain part of it, but that is an observation from the field and not something this data can confirm.
Questions We Get About This Data
How current is it? These are the most recent official figures available, but they describe a period that has already closed. The second quarter ended on 30 June 2026 and REIC published on 11 September 2026. That lag of roughly ten weeks is normal, because the data comes from completed Land Department registrations rather than from sales or reservations. Nothing more recent exists from an official source.
Does a transfer mean a sale that quarter? No. A transfer is the moment ownership changes hands at the Land Department. For an off-plan purchase that can be two or three years after the contract was signed, which is why these numbers reflect decisions made well before the quarter they appear in.
Can I reuse these tables? Yes. REIC’s own terms require that the Real Estate Information Center (ศูนย์ข้อมูลอสังหาริมทรัพย์) be credited as the source of the underlying data, and we would ask that you link back to this page for the translation and the compiled series. Both original Thai PDFs are linked below if you would rather work from the source.
Sources and Method
The figures come from two REIC press releases, both published in Thai:
- “รายงานสถานการณ์การโอนกรรมสิทธิ์ห้องชุดของคนต่างชาติ ไตรมาส 2 ปี 2569 และครึ่งแรก ปี 2569”, published 11 September 2026 (REIC press release 289)
- “สถานการณ์ตลาดที่อยู่อาศัยใน EEC ไตรมาส 2 ปี 2569 และครึ่งแรกปี 2569”, published 15 September 2026 (REIC press release 290)
The underlying source for both is the Department of Lands, compiled and processed by the Real Estate Information Center (ศูนย์ข้อมูลอสังหาริมทรัพย์). We translated the tables directly from the Thai PDFs and converted Buddhist Era years to Gregorian. Everything in the two tables above is published by REIC, including the averages, the shares and the year-on-year percentages. We did not recalculate them.
Exactly three figures on this page are ours rather than REIC’s, and each is labelled where it appears: the first-half 2025 averages used for comparison, the average Chonburi condominium price of about 2.25 million baht, and Chonburi’s roughly 92% share of EEC condominium transfers. All three are simple divisions of figures REIC publishes, and the inputs are given so you can check them.
This page is a factual record of published data. It is not investment, tax or legal advice, and market data on its own does not tell you whether a specific purchase makes sense. For decisions with tax or legal consequences, speak to a qualified professional.
If You Want to Talk About What This Means for a Specific Purchase
Numbers at national level describe a market. They do not describe a building, a floor, or a quota position. If you are weighing a purchase in Pattaya and want to know how these trends read against a particular project, get in touch and we will give you a straight answer, including when the answer is that the timing looks poor.